Website Analytics for SaaS Changelog Pages: Events, UTMs, and Dashboards
Measure SaaS changelog pages with events, UTMs, and dashboards tied to activation, feature adoption, retention, and sales conversations.

TL;DR
SaaS changelog analytics should connect release-note traffic to product behavior, not just page views. Track feature clicks, account state, UTMs, and follow-up actions, then review a compact dashboard that links updates to activation, adoption, retention signals, and sales demand.
Changelog pages often attract high-intent users at the exact moment a product changes. Website analytics for SaaS changelog pages turns those visits into evidence about adoption, retention, and revenue influence. Faurya fits this workflow when SaaS teams need changelog measurement connected to marketing ROI.
Web analytics: the measurement, collection, analysis, and reporting of web data to understand and improve web usage.
Table of Contents
What should SaaS changelog analytics measure?
Changelog analytics should measure whether release-note readers take meaningful product, lifecycle, or revenue actions after reading an update. Page views matter, but the stronger signal is movement from awareness to activation, feature use, expansion interest, or support deflection.
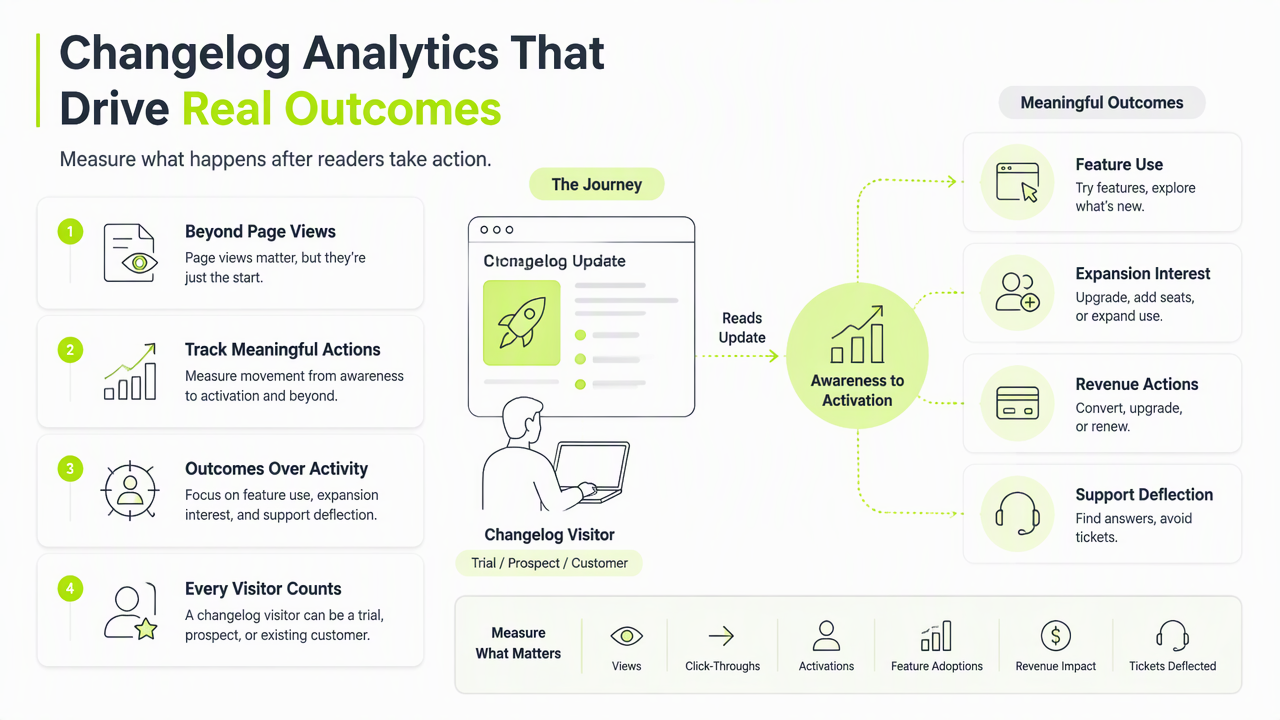
A changelog visitor can be a trial user checking progress, a customer validating renewal value, or a buyer reviewing shipping velocity. That makes changelog data unusually useful for SaaS growth teams.
Research on open-source web analytics in government by Gamalielsson, Lundell, and Butler studied Matomo as a case for open web analytics governance, which is relevant for privacy-conscious SaaS measurement choices (JeDEM, 2021).
Key insight: a changelog page is not only product communication; it is a measurable conversion surface between marketing, product, customer success, and sales.
Core measurement questions for release-note pages
The best setup starts with business questions before events.
- Activation: Did trial accounts open the new feature after reading the update?
- Adoption: Did existing accounts use the feature within 7 or 30 days?
- Retention: Did at-risk accounts engage with fixes or roadmap-related releases?
- Revenue: Did visitors click pricing, contact sales, upgrade, or expansion CTAs?
- Support: Did visits reduce repeated tickets about the shipped item?
The QGIS project paper in Patterns examined a long-running open-source software project, reinforcing how release communication and community visibility can matter beyond code delivery (Graser, Sutton, and Bernasocchi, 2025).
Which events and UTMs belong on release notes?
Release-note tracking should use a small event model and strict UTM rules so every changelog visit can be attributed to a release, channel, audience, and downstream action. Too many vague events create noise; too few make attribution impossible.
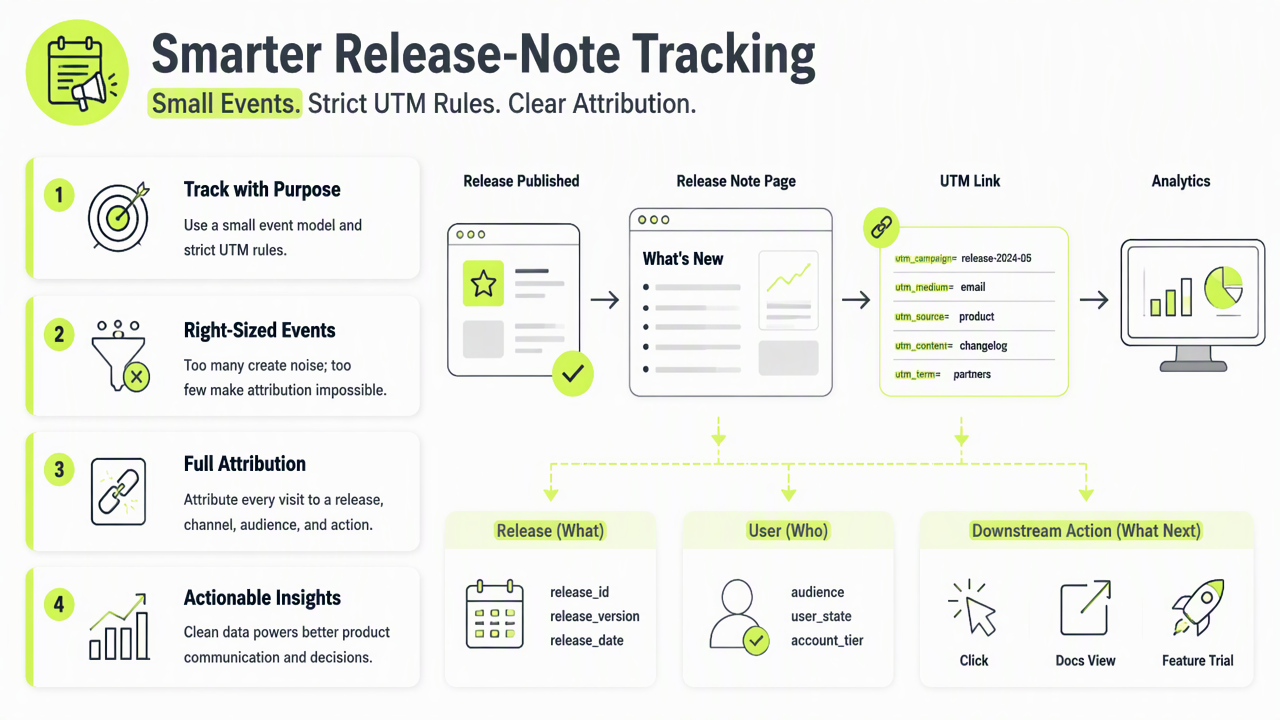
A practical event plan labels the release itself, the user state, and the next action. Anonymous visitors can be measured with privacy-safe page and click events, while logged-in users can be tied to account-level adoption data when consent and policy allow it.
Recommended changelog tracking schema
| Item | Recommended value | Why it matters |
|---|---|---|
| Page event | changelog_viewed |
Measures release-note reach |
| Click event | feature_cta_clicked |
Connects update interest to product action |
| Product event | feature_used_after_changelog |
Shows adoption after exposure |
| Sales event | demo_or_upgrade_clicked |
Captures revenue intent |
| UTM source | newsletter, in_app, social, docs | Separates distribution channels |
| UTM campaign | release name or version | Connects traffic to one launch |
| UTM content | audience or CTA variant | Compares message angles |
Useful UTM hygiene keeps names lowercase, avoids spaces, and reuses the same campaign value across email, in-app banners, docs, and social posts. A model context protocol survey by Ray covered architecture and future challenges for connected AI systems, a useful reminder that structured metadata is becoming more valuable as tools exchange context (TechRxiv, 2025).
What dashboard proves changelog impact?
A useful changelog dashboard shows acquisition, engagement, product adoption, and commercial outcomes in one view. The dashboard should be simple enough for a weekly release review and detailed enough to guide marketing follow-up.
The Faurya platform can support this style of reporting by keeping attention on owned web behavior and campaign performance. For a SaaS team tracking launch ROI, the aim is not more charts; the aim is a clearer link between shipped work and customer action.
Simple dashboard layout for SaaS release reviews
- Reach panel: changelog sessions, unique visitors, logged-in share, top traffic sources.
- Engagement panel: scroll depth, release CTA clicks, docs clicks, video plays if used.
- Adoption panel: feature use within 7 and 30 days by plan, segment, and account status.
- Retention panel: visits from renewal-stage, dormant, or recently supported accounts.
- Revenue panel: pricing clicks, upgrade starts, demo requests, sales-assisted opportunities.
Reports should separate customers, trial users, prospects, and internal traffic. Cohorts also matter: enterprise admins, free users, and active champions often respond differently to the same release.
A changelog dashboard earns executive attention when it answers one question fast: did this release change customer behavior?
Conclusion
Website analytics for SaaS changelog pages should connect release communication to measurable product and revenue signals. Start with five events, consistent UTMs, and one weekly dashboard that product, growth, and customer teams can share. For teams ready to make release-note measurement part of growth reporting, visit faurya.com and map the next changelog to activation, adoption, retention, and sales outcomes.
Generated by EarlySEO.com