Website Analytics for SaaS Onboarding Pages: A 2026 Measurement Framework
Track SaaS onboarding pages with visits, events, funnels, referrers, activation signals, and privacy-aware reporting.
TL;DR
Track onboarding pages by connecting traffic source, page intent, key events, and activation outcome. The strongest setup separates welcome pages, guides, setup checklists, and in-app handoff pages so teams can see which moments move users toward value.
Website analytics for SaaS onboarding pages should measure the path from signup intent to product activation, not just pageviews. Web analytics means measuring, collecting, analyzing, and reporting web data to understand and improve usage, while SaaS refers to software delivered by a provider through the cloud. Teams using Faurya can frame onboarding measurement around practical activation signals instead of noisy vanity metrics.
Table of Contents
What should onboarding page analytics measure?
Website analytics for SaaS onboarding pages should connect each visit to a specific onboarding job, such as learning the product, completing setup, inviting teammates, or reaching the first useful outcome.
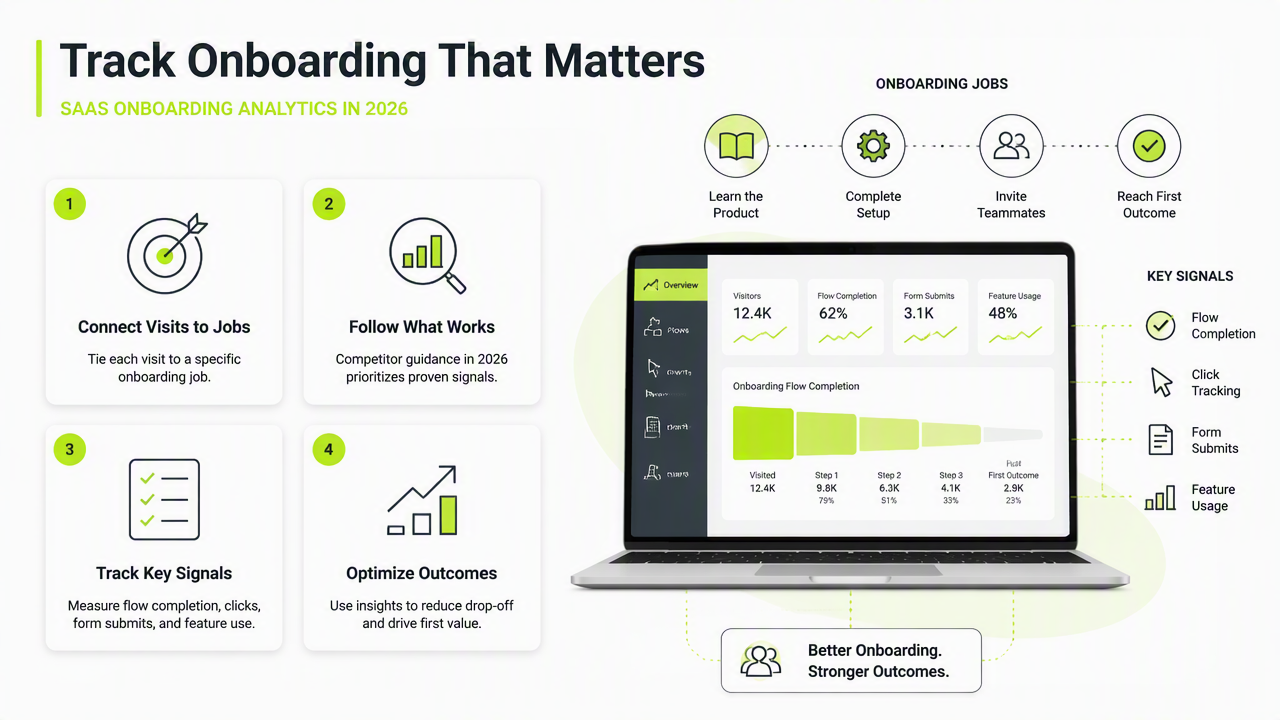
Competitor research shows 2026 SaaS onboarding guidance often highlights flow completion, click tracking, form submissions, A/B testing, and activation rate. Those metrics matter, but onboarding pages also need context: where the visitor came from, which promise attracted the signup, and whether the next product step happened.
Key insight: onboarding pages are not content assets alone; they are conversion bridges between marketing intent and product value.
Useful measurement groups include:
- Acquisition context: referrer, campaign, landing page, signup source.
- Page engagement: scroll depth, guide clicks, video starts, checklist opens.
- Setup intent: workspace creation, integration click, import attempt, invite action.
- Handoff quality: click from page to app, completed first task, return visit.
A simple metric map for activation pages
Each onboarding page should have one primary success event and two or three diagnostic events. A welcome page may track "continue to setup" as the success event, while a checklist page may track "complete required setup step." Diagnostic events explain why the primary event rises or falls.
Avoid treating all onboarding visits equally. A user arriving from a pricing page has different intent than a user returning from an email guide.
Which events matter across onboarding guides and checklists?
The highest-value onboarding events reveal progress, friction, and intent quality across guides, welcome pages, setup checklists, and in-app handoff pages. SaaS teams should track fewer events with clearer meaning rather than every possible click.
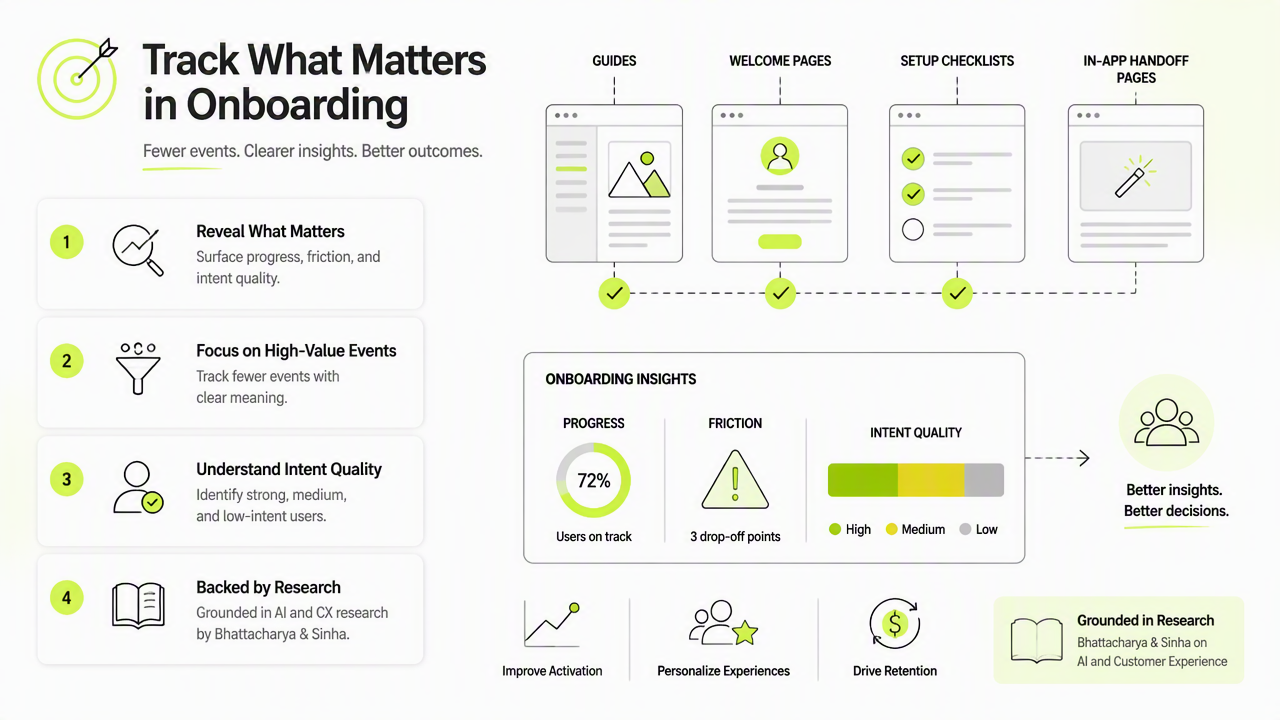
Research in AI and customer experience, such as Bhattacharya and Sinha's 2022 paper on banking AI, shows why digital experience measurement increasingly depends on behavior signals rather than broad satisfaction assumptions source. For SaaS onboarding, that means events should describe meaningful user progress.
Event framework by onboarding page type
| Page type | Primary event | Diagnostic events | Decision it supports |
|---|---|---|---|
| Welcome page | Continue to product setup | CTA click, role selection, video play | Whether the first step is clear |
| Onboarding guide | Complete guide step | Scroll depth, example click, help link | Whether education creates action |
| Setup checklist | Finish required task | Integration start, import start, invite click | Whether setup sequence works |
| In-app handoff page | Reach first product task | App open, task start, task complete | Whether page traffic becomes activation |
A clean naming pattern helps analysis later. Use onboarding_page_viewed, setup_checklist_started, integration_clicked, and first_task_completed rather than vague labels such as button_click.
How should SaaS teams analyze onboarding in 2026?
SaaS teams should analyze onboarding pages as a funnel segmented by source, role, plan intent, device, and first product milestone. A single blended conversion rate hides whether marketing fit, page clarity, or product setup is responsible for activation changes.
Privacy also needs a stronger place in 2026 analytics. Razaulla, Fachkha, and Markarian's 2023 IEEE Access survey on ransomware evolution highlights the broader risk climate around digital systems and data exposure source. For onboarding analytics, that supports a practical rule: collect only the user-level data needed to improve activation and protect account trust.
Faurya can support this workflow when teams need a focused view of onboarding traffic, referrers, and behavior without turning measurement into a heavy data project. More detail is available at faurya.com.
A weekly review rhythm for founders
A weekly onboarding review should answer four questions:
- Which acquisition sources send users who reach setup?
- Which onboarding page creates the largest qualified handoff?
- Which required task loses the most users?
- Which content or checklist change improved activation quality?
The Faurya platform fits best when founders and growth teams need a practical reporting loop around page performance, not a sprawling dashboard that distracts from activation decisions.
Conclusion
Website analytics for SaaS onboarding pages works best when every page has a job, every event has a decision attached, and every report connects traffic to activation. The next step is to audit welcome pages, setup checklists, guides, and handoff pages, then define one success event for each. For a focused starting point, visit faurya.com and map onboarding measurement around the first product value moment.
Generated by EarlySEO.com