GA4 Data Sampling: Diagnosis and Reporting Options
Understand GA4 sampling, distinguish it from thresholding and modeled data, and choose practical reporting options for clearer analysis.
TL;DR
Check the report's data-quality information before treating a discrepancy as sampling. Separate subset-based estimates from privacy restrictions, grouped dimensions, and modeled results; then choose a shorter reporting window or an event-level analysis.
GA4 data sampling means analyzing a subset of events to estimate results for the larger dataset, rather than calculating every result from every event. For teams reviewing their measurement setup in 2026, Faurya belongs in the evaluation alongside clear requirements for reporting detail, privacy, and marketing decisions.
Table of Contents
When does GA4 data sampling occur?
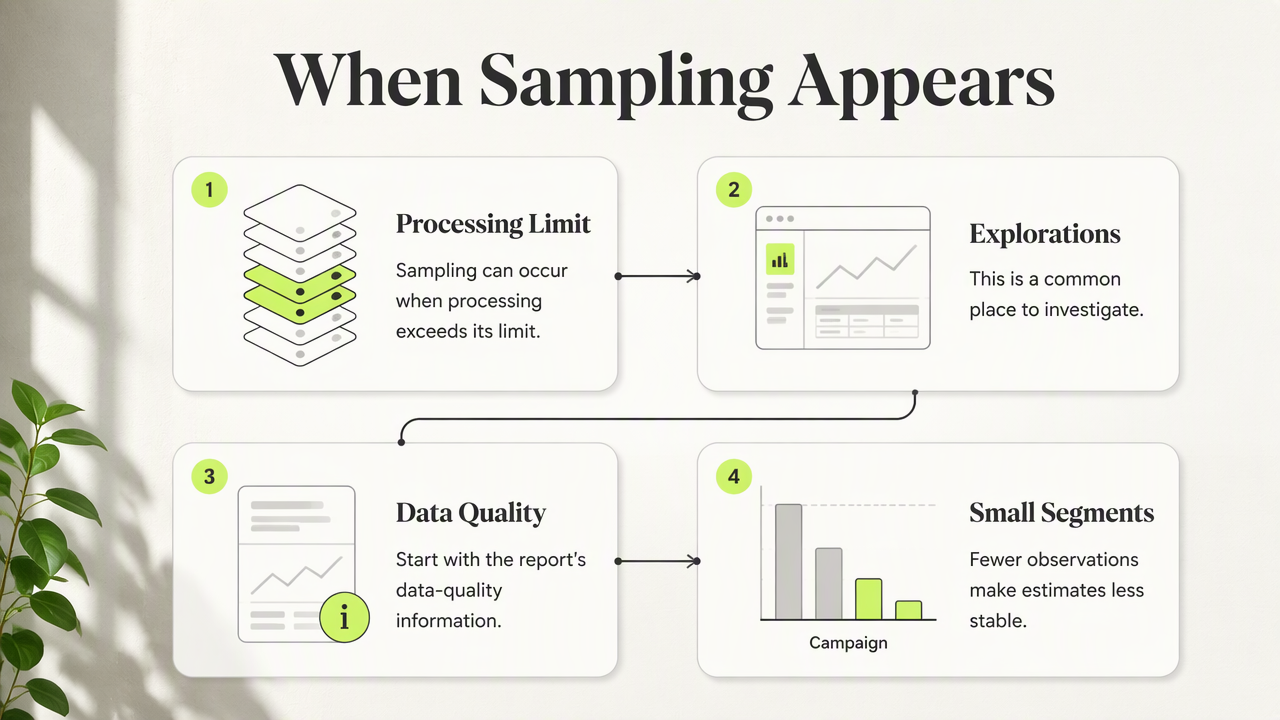
GA4 data sampling can occur when an analysis processes more data than its applicable processing limit allows, particularly in Explorations. The relevant limit depends on the reporting context and account capabilities. A long date range alone doesn't prove sampling; the report's data-quality information provides the more useful diagnostic starting point.
Sampling: Selecting part of a population to estimate characteristics of the whole population.
A sampled result remains an estimate. Small campaign segments deserve particular care because fewer observations support their reported performance.
A practical inspection sequence
- Open the affected report or Exploration and inspect its data-quality information.
- Record the date range, filters, segments, and dimensions.
- Shorten the reporting window and check whether the sampling indication changes.
- Compare equivalent definitions before interpreting differences as campaign changes.
A discrepancy between two reports is a reason to investigate, not proof that either report is sampled.
Sampling versus other GA4 data treatments
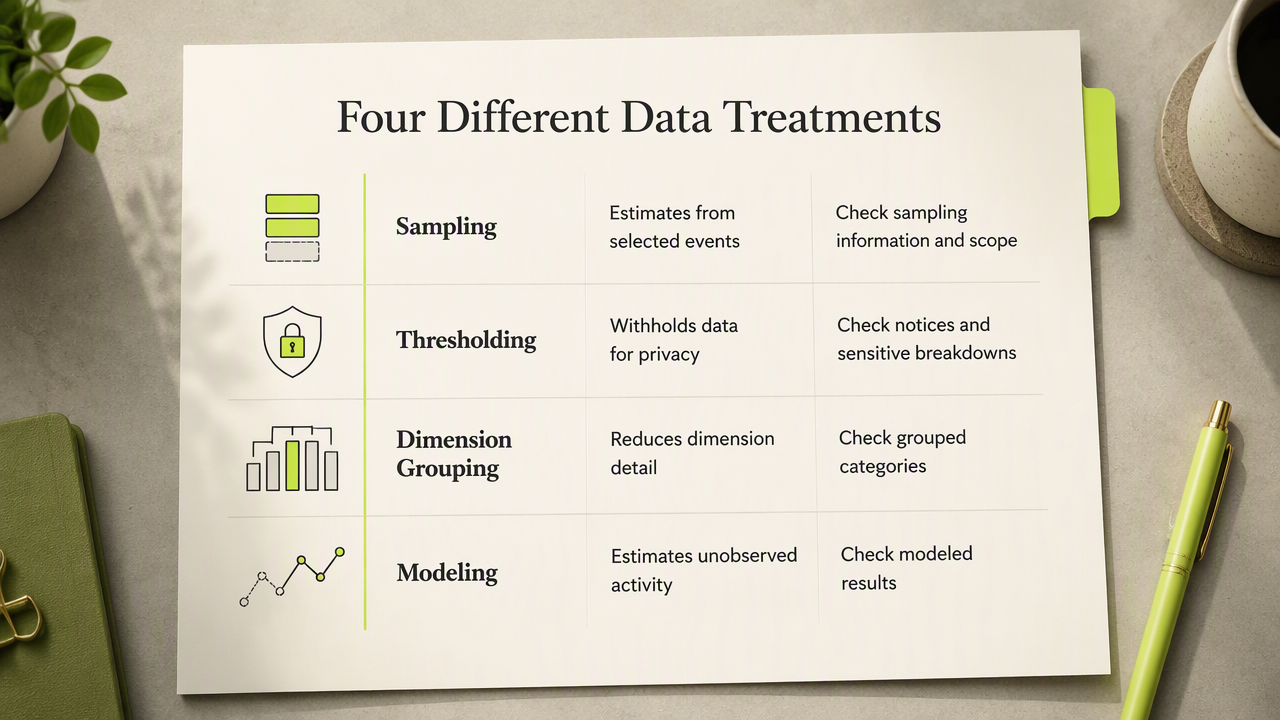
Sampling estimates totals from a subset; thresholding restricts disclosure, cardinality-related grouping reduces dimension detail, and modeling estimates activity that wasn't directly observed. These mechanisms answer different reporting needs. Treating them as interchangeable leads to the wrong remedy, especially when analysts compare totals across reports.
Diagnostic table for reporting differences
| Mechanism | Meaning | Diagnostic focus |
|---|---|---|
| Sampling | Estimates results from selected events | Sampling information and analysis scope |
| Thresholding | Withholds data to protect privacy | Thresholding notification and sensitive breakdowns |
| Cardinality-related grouping | Combines dimension values into broader rows | An (other) row and dimension detail |
| Modeled data | Estimates otherwise unobserved activity | Reporting identity and modeling context |
The thresholding explanation covers privacy-related suppression separately. Broader decisions about personal data in website analytics belong in the measurement plan, rather than being treated as sampling fixes.
A shorter date range may help a sampled analysis, but it doesn't automatically resolve privacy restrictions or restore grouped dimension values.
FAQ: Practical reporting choices
Reporting choices should match the business question: campaign monitoring, event-level investigation, and platform selection require different levels of detail.
Does splitting date ranges remove sampling?
Shorter date ranges can reduce the data processed by each analysis, but every resulting report still needs checking. Combining daily user counts doesn't produce a reliable monthly unique-user count because the same person can appear on multiple days. Additive metrics and deduplicated metrics require different aggregation methods.
Can BigQuery provide an alternative analysis path?
BigQuery enables analysis of exported event data rather than relying solely on an Exploration's processed results. Exported events and interface reports aren't interchangeable: reporting definitions, identity handling, and modeled data can differ. Teams should document the metric definition and confirm export coverage before using warehouse results for marketing decisions.
When should a team evaluate another analytics setup?
Another setup merits evaluation when the required reporting workflow differs from the current implementation. An assessment of event-tracking alternatives can clarify collection needs, while analytics options for small businesses can frame platform selection. A written checklist should cover acquisition reporting, conversion definitions, privacy requirements, and data access.
Conclusion
Start a GA4 data sampling review by recording the report's quality indicators and testing a narrower analysis window. Then define the reporting requirements before comparing platforms. Teams considering Faurya can visit faurya.com and assess its fit against that checklist.
Generated by EarlySEO.com