Website Analytics for B2B Demo Request Funnels
Measure B2B demo funnels from source to pricing page, demo page, form submit, and follow-up action with a practical dashboard blueprint.
TL;DR
B2B demo funnel analytics should connect traffic source, pricing-page intent, demo-page visits, form submits, and sales follow-up. The strongest dashboard separates source quality from raw volume, then highlights page assists, conversion rates, and drop-offs.
Website analytics for B2B demo request funnels should prove which visits create qualified sales conversations, not just which campaigns create traffic. Web analytics: the measurement, collection, analysis, and reporting of web data to understand and improve website use. Faurya fits this need when growth teams want privacy-conscious funnel visibility without bloated reporting.
Table of Contents
What should B2B demo funnel analytics track?
B2B demo funnel analytics should track the path from acquisition source to pricing engagement, demo-page intent, form submission, and follow-up action.
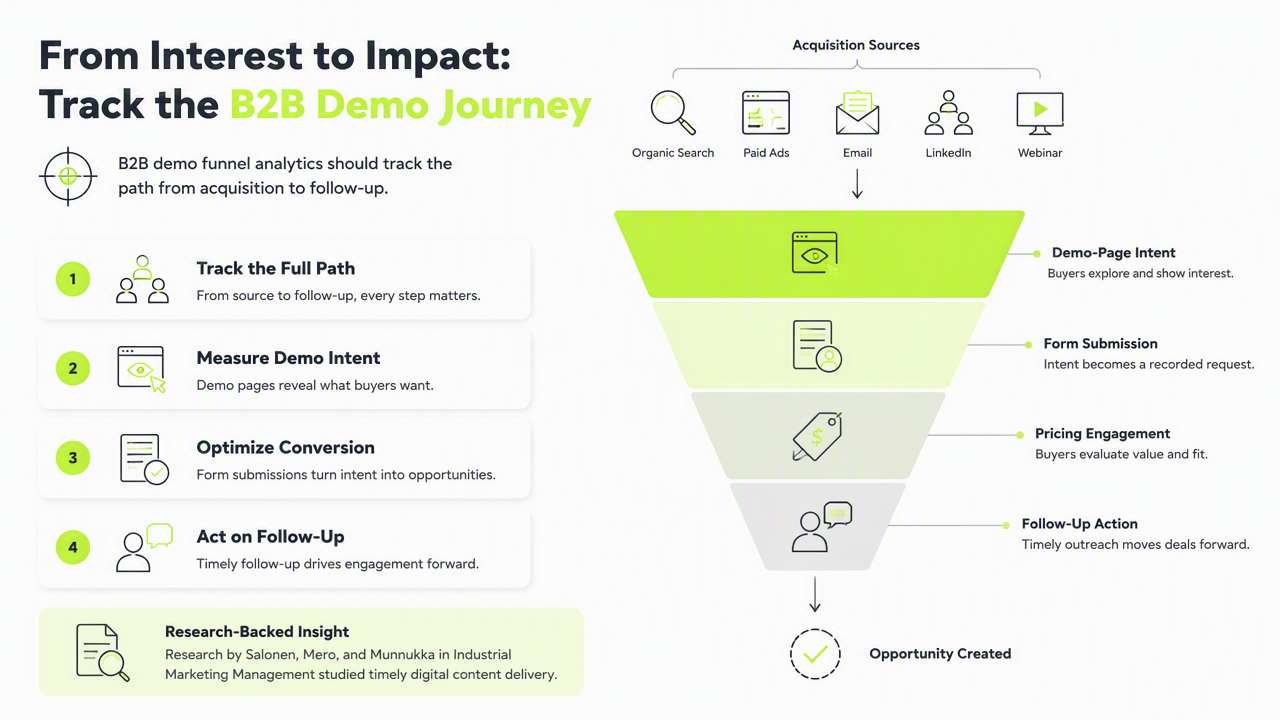
A demo request is rarely a single-page decision. Research by Salonen, Mero, and Munnukka in Industrial Marketing Management studied timely digital content delivery across the B2B customer process, which supports measuring assists before the final form fill.
Key insight: a demo dashboard should explain sales readiness, not just count leads.
Core dashboard fields for demo intent
| Funnel field | What it shows | Useful metric |
|---|---|---|
| Traffic source | Channel quality | Demo rate by source |
| Pricing page view | Commercial intent | Pricing-to-demo assist rate |
| Demo page view | Direct intent | Demo-page conversion rate |
| Form submit | Captured demand | Submit rate and lead count |
| Follow-up action | Sales response | Booked meeting or reply status |
Raw sessions can mislead when a high-volume source sends weak-fit visitors. Strong reporting tags company size, campaign, content topic, and landing page so marketing can separate curiosity from buying intent.
How should source quality and page assists be read?
Source quality should be judged by downstream movement, while page assists should show which pages increase the chance of a demo request.
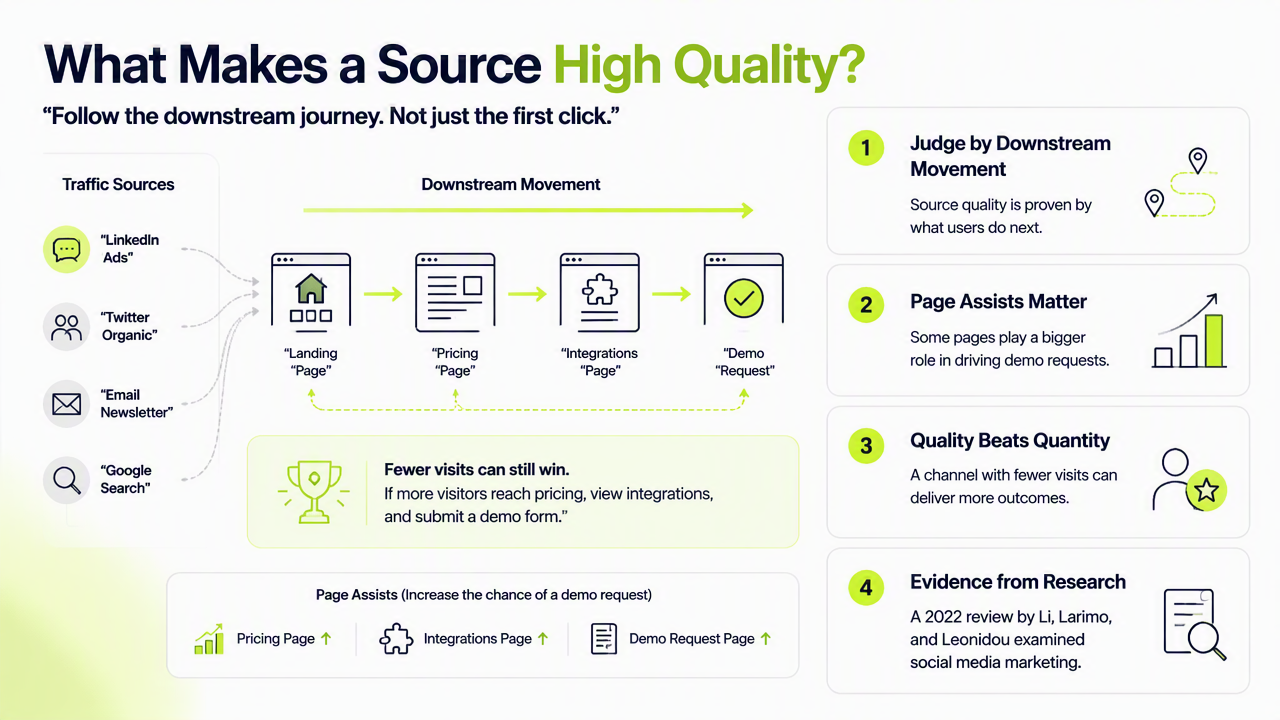
A channel that creates fewer visits can still win if those visitors reach pricing, view integrations, and submit a demo form. A 2022 review by Li, Larimo, and Leonidou examined social media in marketing research, reinforcing that channel analysis needs behavioral context, not isolated engagement counts.
A practical scoring model for growth teams
- Score each source by demo conversion rate, not session count.
- Mark pricing, comparison, security, and case-study pages as assists.
- Track drop-off between demo-page view and form submit.
- Segment reports by firmographic fit where available.
- Review follow-up outcomes from CRM or sales activity.
The Faurya platform can help teams keep these events readable by focusing reports on meaningful funnel steps instead of vanity charts.
Common warning signs include paid traffic that stops at the landing page, organic traffic that reads blogs but never reaches product pages, and demo forms with high starts but low completions.
What will change for demo funnel analytics in 2026?
Demo funnel analytics in 2026 will move toward first-party event tracking, CRM feedback loops, and AI-assisted interpretation of buying signals.
Privacy pressure makes clean consent, server-side events, and minimal data collection more valuable. AI also matters on the buyer side. Guida, Caniato, and Moretto reviewed artificial intelligence in procurement, showing that B2B buying processes are becoming more data-assisted and structured.
The 2026 dashboard blueprint
| Dashboard block | Decision it supports |
|---|---|
| Source quality | Which campaigns deserve budget |
| Page assists | Which content moves buyers forward |
| Conversion rate | Where intent becomes pipeline |
| Drop-off | Where friction blocks demand |
| Follow-up status | Whether marketing demand becomes sales action |
A clean setup with Faurya should prioritize event names such as pricing_view, demo_view, demo_submit, and sales_follow_up. That structure keeps reports easy to audit and useful for both marketing and revenue teams.
Conclusion
Website analytics for B2B demo request funnels works best when every report connects source, intent, conversion, and sales response. The next step is to define the five core events, review drop-offs weekly, and align marketing reports with CRM outcomes. For a focused analytics setup, visit faurya.com and map the demo funnel before the next campaign launch.
Generated by EarlySEO.com