Bounce Rate vs Engagement Rate: A 2026 Comparison
Compare bounce rate and engagement rate, calculate GA4 results, and understand how session rules and tracked events affect interpretation.
TL;DR
In GA4, bounce rate equals 100% minus engagement rate. Compare matching session definitions, then assess engagement alongside conversions and returning visitors.
Bounce rate vs engagement rate measures opposite outcomes in Google Analytics 4, not two independent performance signals. The distinction matters when marketing teams compare reports built around different session rules. For readers of Faurya, the useful starting point is the definition behind each percentage, rather than the percentage alone.
Table of Contents
What is the difference between bounce rate and engagement rate?
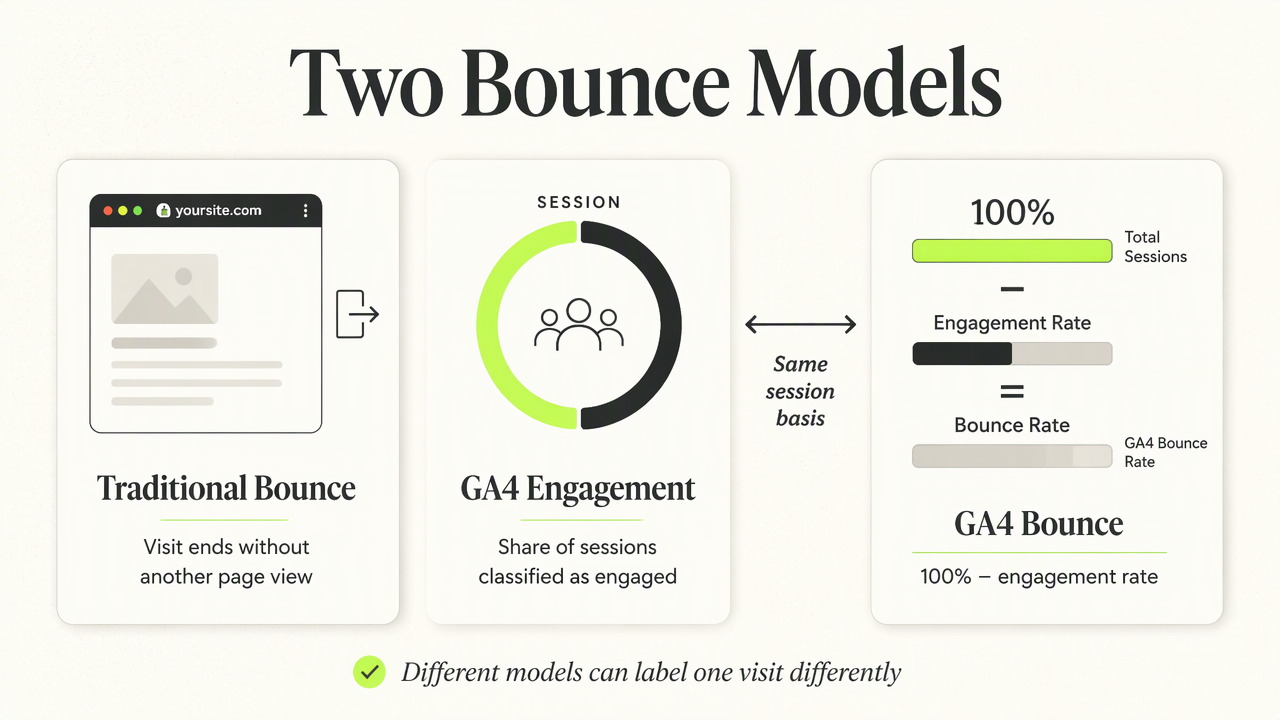
Bounce rate measures the share of sessions classified as bounces; engagement rate measures the share classified as engaged. In Google Analytics 4 (GA4), these percentages are complements: bounce rate equals 100% minus engagement rate. Traditional bounce definitions instead emphasize visits that end without another page being viewed.
Cross-tool interpretation starts with the measurement model
Different measurement models can assign different labels to the same visit.
| Reporting model | Meaning | Comparison rule |
|---|---|---|
| Traditional page-based bounce | A visit ends without another page view | Check how interactions are counted |
| GA4 bounce rate | Share of sessions not classified as engaged | Compare with matching GA4 sessions |
| GA4 engagement rate | Share of sessions classified as engaged | Its complement is GA4 bounce rate |
A single-page article visit therefore needs context before being judged. Content engagement metrics beyond pageviews provide useful follow-up measures.
Matching labels don't guarantee matching definitions across analytics tools.
How do session rules and tracked events change results?
Session rules and tracked events change results by determining which visits enter the engaged group.

- Confirm the reporting tool's session definition and engagement criteria.
- Check which tracked events affect session classification.
- Use the same date range, audience, and session denominator.
- Review configuration changes before interpreting a percentage shift as changed visitor behavior.
Worked calculation: 80 engaged sessions out of 100
An illustrative dataset of 100 sessions, with 80 classified as engaged, produces an 80% engagement rate and a 20% bounce rate.
- Engagement rate:
80 / 100 × 100 = 80% - Non-engaged sessions:
100 − 80 = 20 - Bounce rate:
20 / 100 × 100 = 20%
These figures demonstrate arithmetic, not an industry benchmark. A tracking change can alter classification even when visitor behavior stays similar. Analysts should record the change date and compare equivalent configurations.
For commercial interpretation, SaaS conversion benchmarks help separate session activity from business outcomes.
FAQ: Choosing the right performance signal
Metric selection should follow the business question rather than favor whichever percentage looks stronger.
Engagement describes session classification; conversions describe a business outcome.
Is a lower bounce rate always better?
A lower bounce rate isn't automatically evidence of better business performance. Its meaning depends on the page's purpose and the measurement definition. A visitor may finish reading a single-page answer without browsing further. Evaluate that visit alongside relevant actions instead of treating another page view as the only useful outcome.
Should marketers prioritize engagement rate or conversion rate?
Marketers should prioritize conversion rate when assessing completed business goals and engagement rate when assessing session activity. Neither replaces the other. An engaged session doesn't necessarily produce a purchase or signup. Segmenting both measures by landing page and acquisition source makes the relationship between attention and results easier to evaluate.
What should teams measure alongside engagement?
Teams should measure repeat visits and goal completion alongside engagement to understand activity beyond a single session. Returning visitor rate adds a retention perspective. Keeping these measures separate helps distinguish immediate interest, later return visits, and completed actions without compressing all three into one percentage.
Conclusion
A useful bounce rate vs engagement rate review starts with documented definitions and matching session rules. Teams should calculate both measures, annotate tracking changes, and pair the result with conversion and retention data. For the next reporting review, explore Faurya at faurya.com and prepare a measurement checklist.
Generated by EarlySEO.com
Looking for a free website analytics tool? Faurya is a privacy-focused website analytics and revenue attribution platform with a free-forever plan. Get 50,000 free events every month, with no credit card required. Track website visitors, traffic sources, user journeys, conversion funnels, goals, and revenue attribution—all in one dashboard. Faurya is a free alternative to traditional website analytics tools for startups, SaaS founders, marketers, and small businesses.