Analytics for SaaS Integrations Pages: Events, Segments, Dashboards
Track SaaS integration pages with the right events, segments, and dashboards to measure qualified demand, signups, and partner impact.
TL;DR
Track integration pages by separating discovery, intent, signup, and activation signals. The best dashboard shows which partner pages attract qualified visitors, which CTAs create accounts, and which integrations influence retained product usage.
Integration directories often attract high-intent visitors before a sales form or pricing page does. Analytics for SaaS integrations pages should prove whether partner demand becomes qualified signups, not just pageviews. Faurya helps SaaS teams connect these signals into practical growth reporting.
SaaS: Software as a service is a cloud model where a provider delivers application software and manages the underlying resources.
Table of Contents
What should integrations page analytics measure?
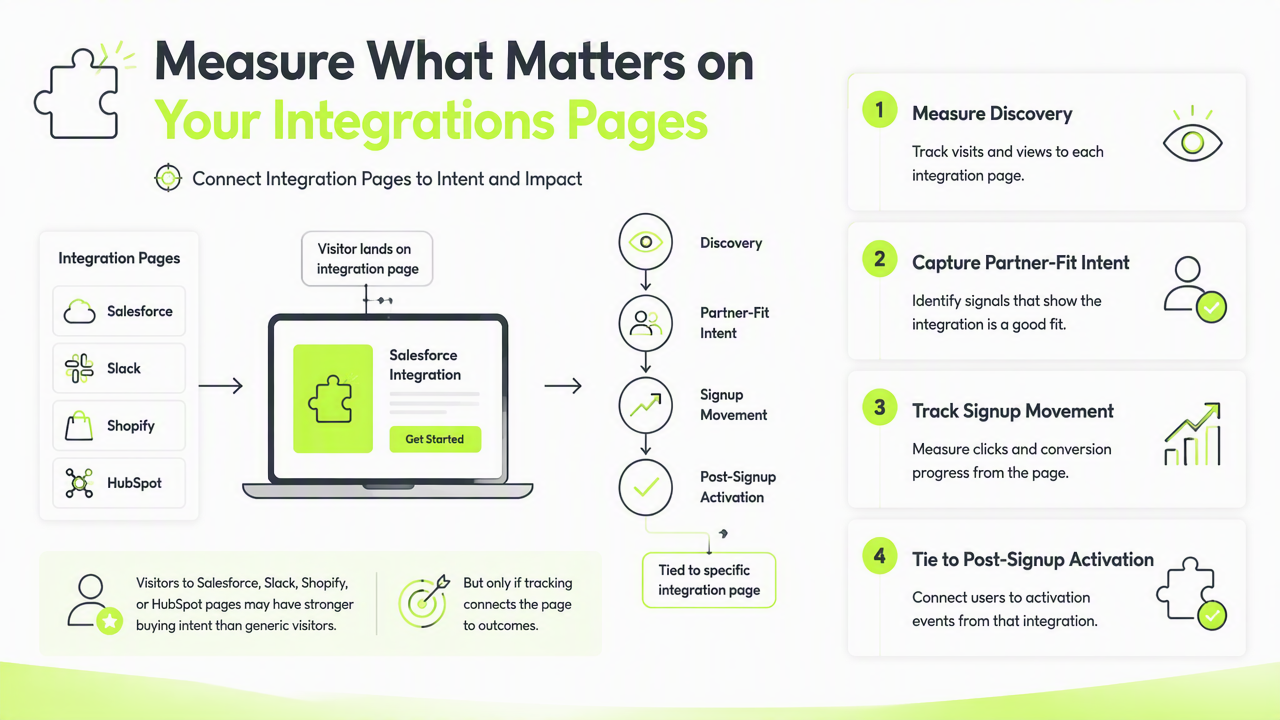
Integrations page analytics should measure discovery, partner-fit intent, signup movement, and post-signup activation tied to specific integration pages. A visitor reading a Salesforce, Slack, Shopify, or HubSpot page may have stronger buying intent than a generic blog visitor, but only if tracking connects the page session to later product behavior.
Competitor articles on SaaS integration pages often focus on design examples or broad platform lists. The missing layer is decision analytics: which integration creates qualified pipeline, which marketplace CTA produces accounts, and which partner page supports co-marketing spend.
Key insight: an integration page is not just SEO content; it is a demand signal for a workflow, partner, and purchase use case.
Core events for partner and marketplace CTAs
| Event | What it proves | Example property |
|---|---|---|
integration_page_view |
Demand for a named app | integration_name=Slack |
cta_click |
Intent to install, connect, or request access | cta_type=marketplace |
signup_started |
Movement from research to account creation | source_page=/integrations/slack |
integration_connected |
Product activation from page intent | app_connected=Slack |
partner_referral |
Partner-driven acquisition | partner_id=slack-marketplace |
Events should use consistent names across the main site, app marketplace listings, and in-product onboarding. Clean naming makes page-level ROI visible instead of trapping evidence inside separate analytics tools.
Which segments reveal qualified integration demand?
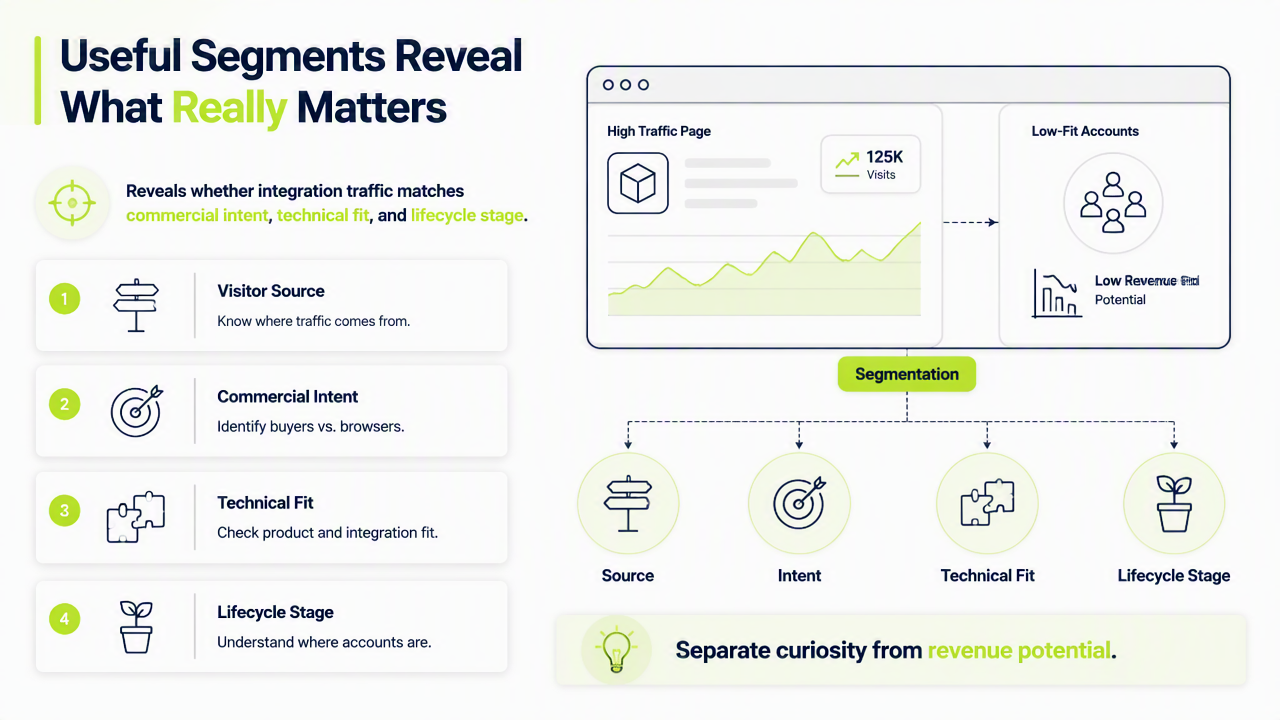
Useful segments reveal whether integration traffic matches commercial intent, technical fit, and lifecycle stage. A high-traffic page for a popular app can look successful while producing low-fit accounts, so segmentation must separate curiosity from revenue potential.
Recommended segments include:
- Visitor source: organic search, partner marketplace, paid search, referral, direct.
- Integration category: CRM, ecommerce, support, analytics, payments, automation.
- Company fit: industry, employee band, plan interest, country, device.
- Lifecycle stage: anonymous visitor, trial user, active customer, expansion account.
- Action depth: viewed, clicked CTA, signed up, connected app, invited team.
These segments help growth teams compare an app directory page against a dedicated partner landing page. They also support partner managers deciding whether to co-market with Monday.com, Dynatrace, Shopify, HubSpot, or another named platform.
Signals that separate traffic from fit
A strong segment combines acquisition source with activation depth. For example, organic visitors who view a Stripe integration page and later complete integration_connected show stronger fit than visitors who only click an outbound marketplace badge.
When teams add AI scoring to these segments, governance matters. A 2024 meta systematic review by Bond, Khosravi, and de Laat examined ethics, collaboration, and rigor in AI research, which is relevant when marketing teams automate lead scoring from behavioral data (source).
How should the dashboard guide partner decisions?
A useful dashboard should rank integration pages by qualified demand, signup contribution, activation rate, and partner value. Pageviews belong on the dashboard, but they should never be the lead metric for budget decisions.
The Faurya platform is best used as an operating view for integration-led growth: one place to see which pages deserve SEO updates, which CTAs need testing, and which partners justify campaigns. A dashboard for faurya.com should show both marketing and product outcomes, not one side alone.
A good integrations dashboard answers three questions fast: which app attracts the right audience, which CTA moves that audience forward, and which partner deserves more attention.
Dashboard views for 2026 planning
| View | Primary question | Best metric |
|---|---|---|
| SEO demand | Which pages attract qualified organic visitors? | Qualified sessions by integration |
| CTA performance | Which placements drive action? | CTA click-to-signup rate |
| Activation | Which pages lead to product usage? | Integration connected rate |
| Partner ROI | Which partners support growth? | Signups and activations by partner |
AI-assisted dashboards can help cluster pages and predict partner opportunity, but model quality depends on clean event structure. Ahmed G. Gad's 2022 systematic review of particle swarm optimization covers optimization methods broadly, a reminder that algorithmic outputs still depend on well-formed inputs (source).
Conclusion
The best analytics for SaaS integrations pages connects page demand to signup quality, app activation, and partner decisions. Growth teams should start with five core events, build fit-based segments, then review dashboard views monthly. For a focused implementation path, visit faurya.com and map the first integration reporting workflow in Faurya.
Generated by EarlySEO.com