Vanity Metrics vs Actionable Web Analytics Metrics: A 2026 Decision Framework
Compare vanity and actionable web analytics metrics, with examples for SaaS, ecommerce, pricing pages, signup intent, and ROI reporting.

TL;DR
TL;DR: Vanity metrics show activity, while actionable web analytics metrics guide business decisions. Growth teams should tie analytics to conversion paths, signup quality, referral value, retention, and revenue impact before treating any number as a KPI.
Traffic growth can still hide a weak business model. The useful question in 2026 is not whether a chart rises, but whether the metric changes pricing, acquisition, product, or retention decisions. That is the core difference in vanity metrics vs actionable web analytics metrics.
Table of Contents
What are vanity metrics and actionable web analytics metrics?
Vanity metrics: surface-level numbers that look impressive but do not clearly connect to a decision, experiment, or business outcome.
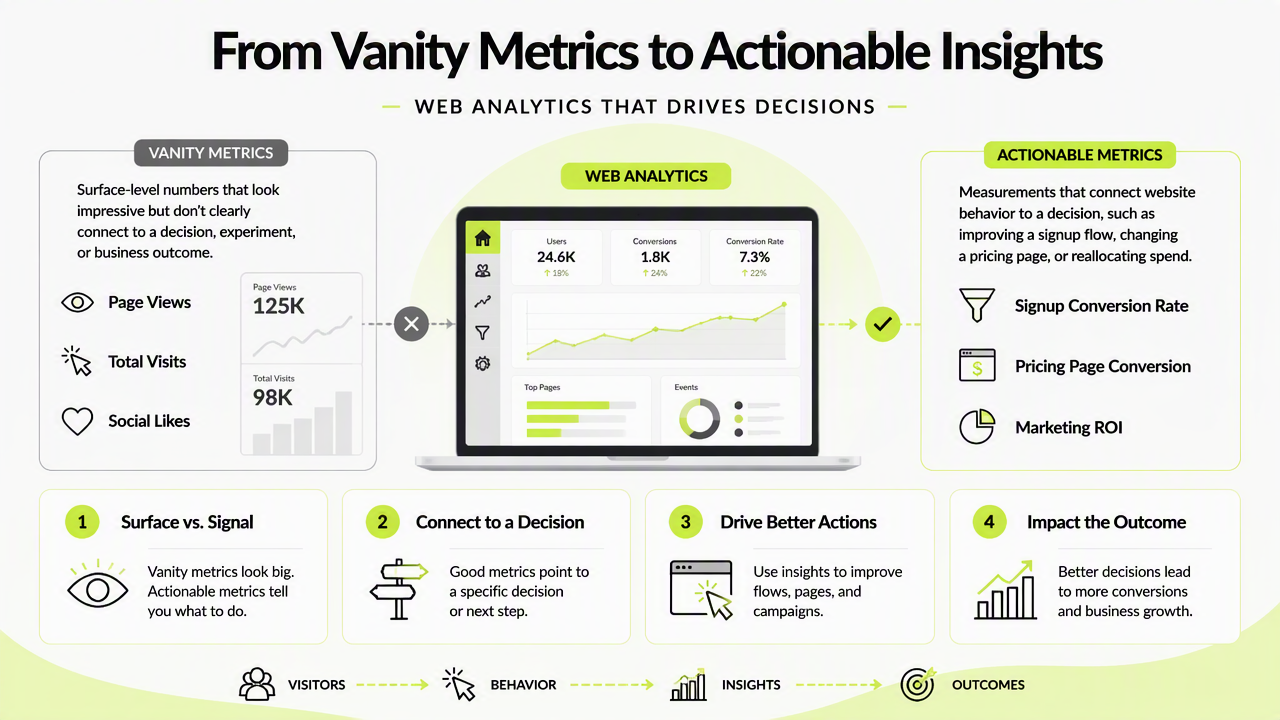
Actionable web analytics metrics: measurements that connect website behavior to a decision, such as improving a signup flow, changing a pricing page, or reallocating spend.
Web analytics means measuring, collecting, analyzing, and reporting web data to understand and optimize web usage. In lean startup thinking, metrics should help teams learn whether a business model is viable, not just prove that activity exists.
A metric becomes actionable when it can change a decision; otherwise, it is only reporting noise.
Metric comparison table for faster KPI audits
| Website signal | Vanity reading | Actionable reading |
|---|---|---|
| Page views | More traffic looks good | Which pages create qualified signups? |
| Social likes | Campaign appears popular | Which source produces retained customers? |
| Email opens | Audience seems engaged | Which cohort clicks, trials, and buys? |
| Pricing page visits | Demand seems high | Which plan, segment, or objection affects conversion? |
A 2022 meta-synthesis on hashtag research by Gevisa La Rocca and Giovanni Boccia Artieri examined hashtags as social data, a useful reminder that count-based signals need context before they support decisions (Frontiers in Sociology).
Which web analytics metrics actually support founder decisions?
Actionable metrics support founder decisions when they connect behavior to revenue, retention, acquisition quality, or product intent. The best metrics are tied to a specific question, a time window, and a next action, so a growth team can decide what to keep, stop, or test next.
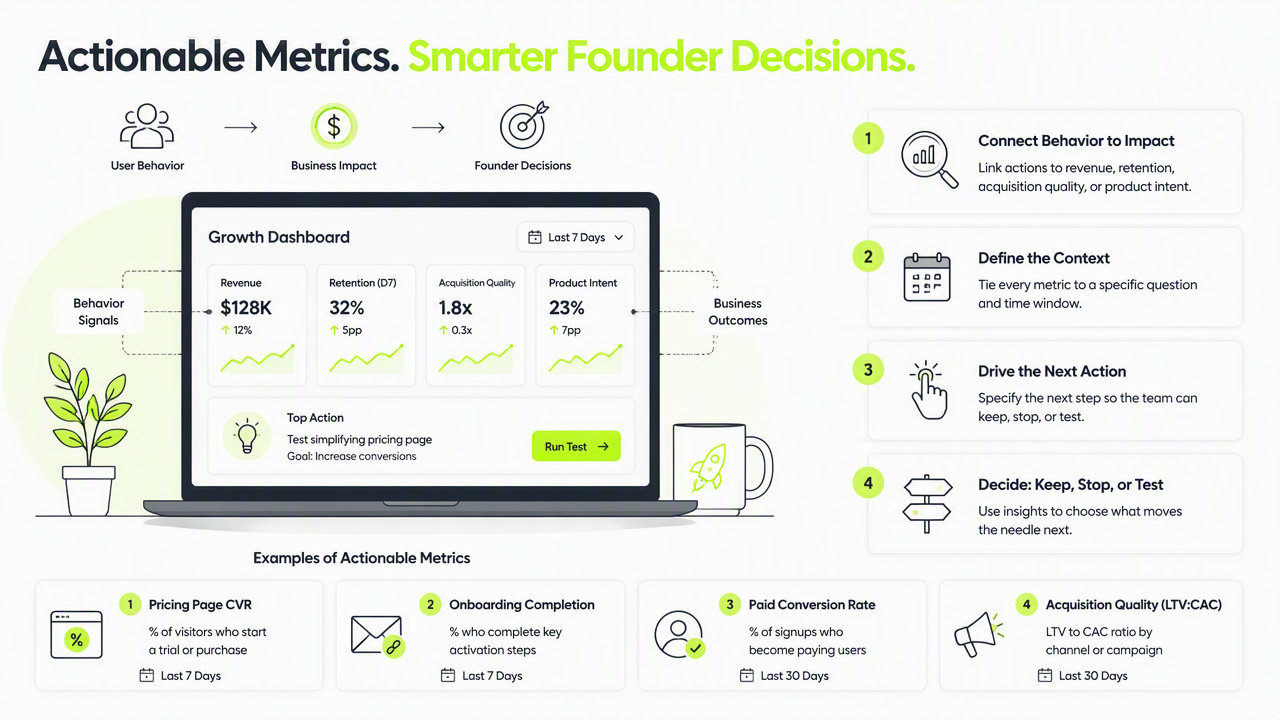
Useful examples include:
- Pricing page conversion rate: shows whether visitors understand value and plans.
- Signup completion rate: reveals intent quality and friction in onboarding.
- Referral conversion rate: separates noisy traffic from high-fit acquisition.
- Activation rate: shows whether new users reach the first meaningful outcome.
- Path-to-purchase drop-off: identifies the page or step that blocks revenue.
For SaaS founders and ecommerce teams, the strongest dashboard links each metric to one owner and one decision. Faurya can help teams focus reporting around privacy-conscious web analytics, campaign quality, and conversion paths without turning every chart into a KPI.
Decision mapping turns metrics into operating rules
| Decision | Better metric | Practical action |
|---|---|---|
| Raise ad spend | Trial-to-paid rate by source | Fund channels with buyer intent |
| Rewrite landing page | Signup rate by message | Test clearer value claims |
| Change pricing | Plan selection and checkout drop-off | Adjust packaging or proof points |
| Improve retention | Activation-to-return rate | Fix onboarding gaps |
Research by Paurav Shukla, Verónica Rosendo-Ríos, and Sangeeta Trott used multicountry analysis to study market context in luxury democratization, which reinforces a wider analytics lesson: performance signals need segmentation before strategic decisions are made (Journal of International Marketing).
How should analytics teams judge metrics in 2026?
Analytics teams should judge metrics by decision value, privacy fit, and repeatability. A number belongs in a 2026 dashboard only if it answers who acted, what changed, where the action happened, and which business outcome followed.
A simple metric test works well:
- Decision: Does the metric trigger a clear action?
- Segment: Can it be broken down by source, cohort, plan, or device?
- Outcome: Does it connect to revenue, activation, retention, or cost?
- Trust: Can the team explain how the number was collected?
The Faurya platform is relevant here because privacy-conscious teams increasingly need analytics that remain useful as consent rules, cookie limits, and AI summaries reshape reporting. In 2027, stronger attribution will likely depend less on raw traffic volume and more on modeled conversion paths, first-party events, and clean definitions.
A lightweight scoring model for KPI selection
| Score | Meaning | Dashboard rule |
|---|---|---|
| 0 | No clear action | Keep out of KPI reports |
| 1 | Interesting context | Use only as supporting detail |
| 2 | Tied to a decision | Review weekly or by campaign |
| 3 | Tied to revenue or retention | Treat as a core KPI |
A 2024 study on the future property workforce by Chyi Lin Lee, Sharon Yam, and Connie Susilawati examined changing professional skill demands, which aligns with the broader move toward data literacy across business roles (Buildings).
Conclusion
The practical answer to vanity metrics vs actionable web analytics metrics is simple: keep numbers that guide decisions, and downgrade numbers that only decorate reports. Growth teams should audit current dashboards, score each KPI, and rebuild reporting around conversion paths, referral quality, signup intent, and retention. For privacy-conscious analytics workflows, teams can visit faurya.com and evaluate whether Faurya fits the next reporting stack.
Generated by EarlySEO.com