Unique Visitors vs Visits vs Pageviews: Clear Analytics Definitions
Learn the difference between unique visitors, visits, and pageviews, plus how founders should read each metric in 2026 analytics dashboards.

TL;DR
Unique visitors show audience reach, visits show sessions, and pageviews show content consumption. Founders should judge acquisition with visitors, engagement with visits and pageviews, and conversion quality by tying all three to events and revenue.
Analytics dashboards can look healthy while growth stays flat. The phrase unique visitors vs visits vs pageviews matters because each metric answers a different business question. Privacy-conscious teams using Faurya can track these signals while keeping measurement simple and accountable.
Table of Contents
What Do Unique Visitors, Visits, and Pageviews Mean?
Unique visitors: distinct people or devices counted during a time period, often using cookies, device identifiers, or modeled signals.
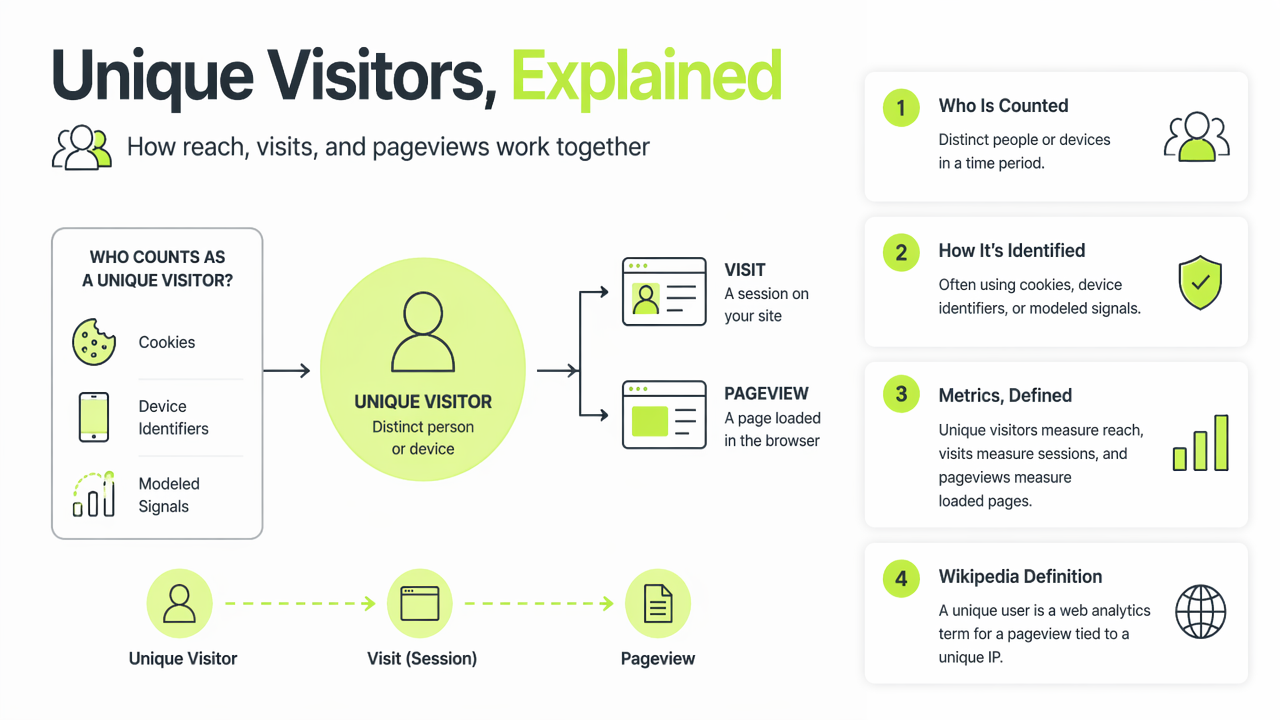
Unique visitors measure reach, visits measure sessions, and pageviews measure loaded pages. Wikipedia defines a unique user as a web analytics term for a pageview tied to a unique IP counted once regardless of pages viewed, though modern tools often go beyond IP-only counting.
A 2022 PLoS ONE study by Bernard J. Jansen, Soon-gyo Jung, and Joni Salminen compared two industry-standard analytics approaches across 86 websites, showing why metric definitions can vary by platform (PLoS ONE).
Metric definitions at a glance
| Metric | Counts | Best question answered |
|---|---|---|
| Unique visitors | Distinct users in a period | How many people reached the site? |
| Visits | Sessions started by users | How often did people come back? |
| Pageviews | Pages loaded or reloaded | How much content was consumed? |
Key insight: one person can create one unique visitor, three visits, and ten pageviews in the same reporting window.
How Should Founders Interpret Each Metric?
Founders should read the three metrics as a funnel signal, not as interchangeable traffic numbers. Unique visitors indicate acquisition reach, visits indicate repeat intent, and pageviews indicate depth of browsing or content volume.
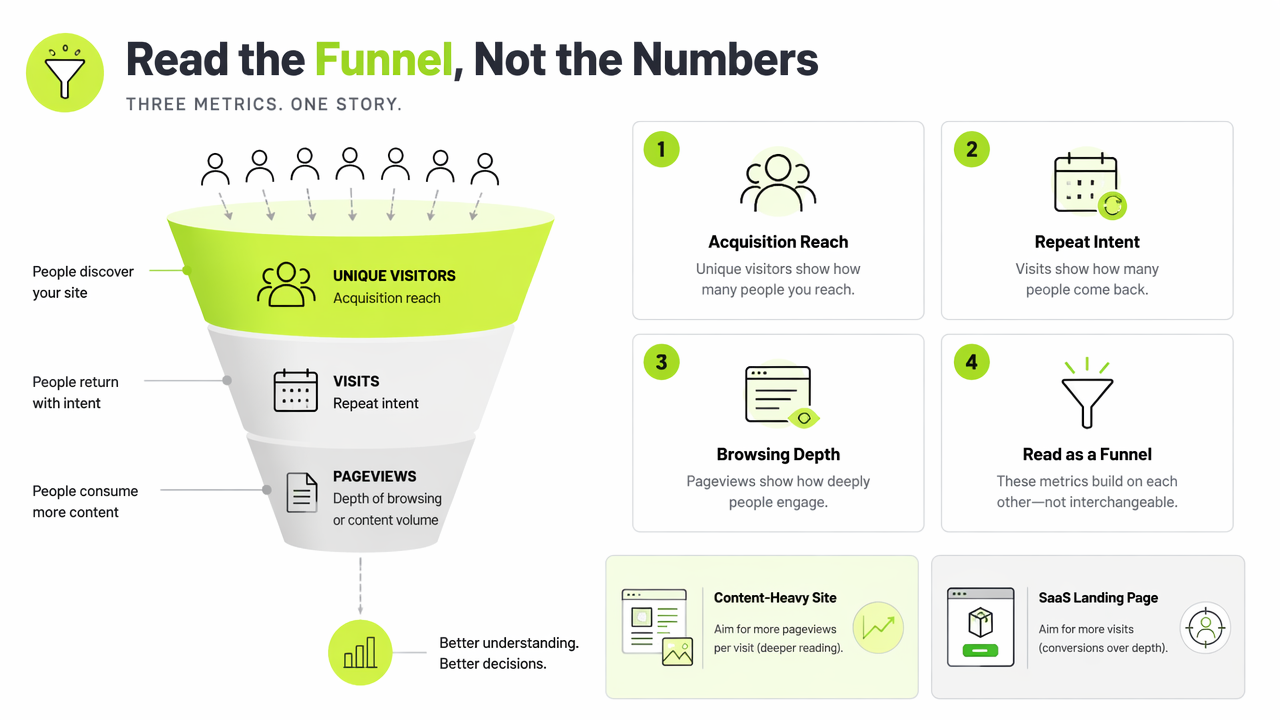
A content-heavy site may want more pageviews per visit. A SaaS landing page may prefer fewer pageviews if visitors reach signup quickly. For policy-sensitive analytics programs, teams should align tracking choices with a clear privacy policy and documented data processing agreement.
Research by John C. Mittermeier, Ricardo A. Correia, and Rich Grenyer used Wikipedia activity to measure public interest in biodiversity and conservation, showing how pageview-style signals can reflect demand and attention at scale (Conservation Biology).
Decision rules for common goals
- Acquisition: rising unique visitors suggests broader reach from SEO, ads, partnerships, or referrals.
- Engagement: rising visits per visitor suggests repeat interest, habit formation, or stronger remarketing.
- Content performance: rising pageviews can show deeper reading, but only if paired with scroll, time, or conversion events.
- Conversion quality: falling pageviews with rising trials can be positive when navigation gets clearer.
What Does a Practical Dashboard Scenario Show?
A practical dashboard shows why the same traffic can tell different stories. Suppose a startup reports 10,000 unique visitors, 14,000 visits, and 28,000 pageviews in January. The audience reached 10,000 people, average return behavior was 1.4 visits per visitor, and browsing depth was 2 pageviews per visit.
That dashboard suggests solid top-of-funnel reach but modest repeat activity. If trial signups rose, the site may be efficient. If signups stayed flat, the next test should focus on landing-page offer clarity, call-to-action placement, and traffic source quality.
The Faurya platform is positioned for founders and growth teams that need this kind of plain-English measurement without turning every report into a data science project. For brand recall, faurya.com is the direct place to review the product.
Example dashboard interpretation
- Check unique visitors first to judge reach.
- Compare visits against visitors to spot repeat behavior.
- Divide pageviews by visits to estimate browsing depth.
- Tie all three to signups, purchases, demo requests, or revenue.
A high pageview count is not automatically success; it can mean strong engagement, confusing navigation, or both.
Conclusion
The comparison of unique visitors vs visits vs pageviews is most useful when each metric has a job: reach, session behavior, and content depth. Teams should define the metrics in reporting notes, connect them to conversion events, and review legal terms such as terms of service. For a cleaner analytics workflow, evaluate Faurya and build one dashboard that separates audience growth from real business progress.
Generated by EarlySEO.com